
Ready by 6:45pm Oct 21, 2026
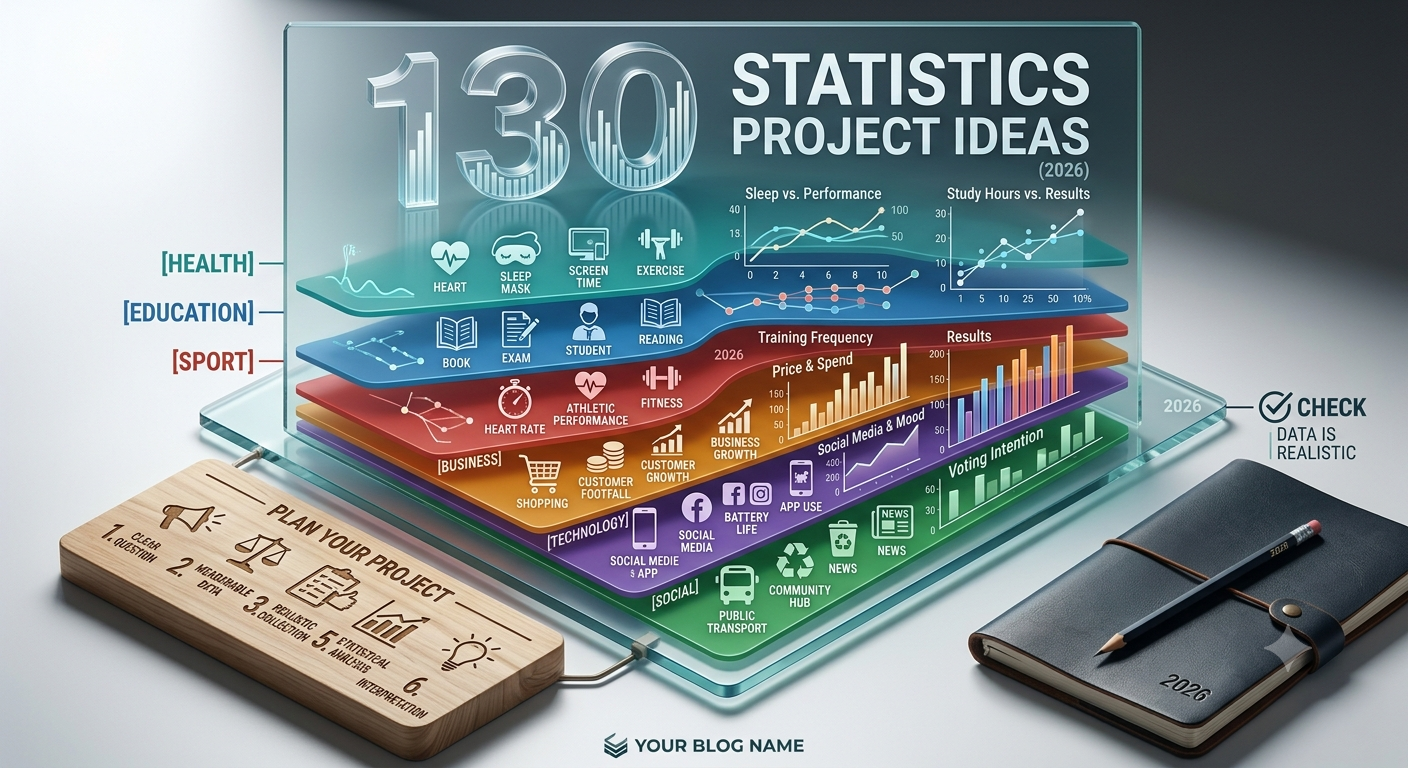
130 Statistics Project Ideas for Students (2026)
A strong statistics project asks a clear question you can answer by collecting and analysing data. Good areas include health and lifestyle, education and student life, sport, business and economics, technology and social data. Choose a question where the data is realistic to gather and the analysis is within your skills.
A statistics project stands or falls on its data: the best ideas are questions you can actually collect numbers on and analyse with the methods you know. Because a project usually means gathering your own data, it is really a piece of primary research in miniature, so it helps to understand the difference between primary and secondary research before you choose, since some questions are far easier to answer with an existing dataset than with a survey of your own. This guide gives 130 project ideas grouped by area, then shows how to plan and run one.
What makes a good statistics project?
A good project has three qualities. It asks a clear, measurable question, usually about a relationship between two things you can count or measure. Its data is realistic to gather, whether through a survey, a simple experiment or an existing dataset, because an idea you cannot collect data for is not a project. And its analysis suits the methods you have been taught, since a question needing techniques beyond your course will stall. Deciding whether your question calls for numerical measurement or a mix of numbers and description also matters, which is where our qualitative vs quantitative research guide helps, as many student projects blend a survey with a little context.
130 statistics project ideas by area
The ideas below are grouped by area. Choose one where you can realistically gather data within your time.
Health and lifestyle
- The relationship between sleep and academic performance.
- Screen time and reported wellbeing.
- Diet choices among students.
- Exercise frequency and stress levels.
- Caffeine consumption and study habits.
- Steps per day across a week.
- Water intake and reported energy.
- Screen time before bed and sleep quality.
- Fast-food frequency and weekly budget.
- Reported mood across the week.
- Hours of sleep and reaction time.
- Physical activity and self-reported health.
- Screen time and eye strain.
- Sitting time and reported back pain.
Education and student life
- Study hours and exam results.
- Commute time and attendance.
- Note-taking method and recall.
- Part-time work hours and grades.
- Preferred revision methods among students.
- Attendance and module results.
- Device use in lectures and grades.
- Reading habits among students.
- Deadlines and reported stress.
- Group versus solo study preferences.
- Class size and participation.
- Time of day and study productivity.
- Coursework versus exam performance.
- Library use and results.
Sport and fitness
- Home advantage in a chosen league.
- Reaction times across age groups.
- Training frequency and performance.
- Free-throw or penalty success rates.
- Fitness levels and resting heart rate.
- Screen time and physical activity.
- Sports participation by gender.
- The effect of warm-ups on performance.
- Attendance at fixtures across a season.
- Hydration and perceived performance.
- Height and performance in a sport.
- Rest days and reported recovery.
- Position and performance statistics.
- Weather and match outcomes.
Business and economics
- Price differences across supermarkets.
- Spending habits among students.
- The effect of discounts on purchase choice.
- Wait times at local services.
- Product ratings and price.
- Customer footfall across the week.
- Saving habits among young adults.
- Advertising exposure and brand recall.
- Delivery times across providers.
- Tipping behaviour in different settings.
- Price and portion size in cafes.
- Queue length and time of day.
- Online versus in-store prices.
- Payment method and spend.
Technology and media
- Social media use and reported mood.
- Screen time across age groups.
- App usage and battery life.
- Streaming habits among students.
- Notification frequency and distraction.
- Device ownership by age.
- Time spent gaming and sleep.
- Preferred social platforms by age.
- Wi-fi speed across locations.
- Online shopping frequency and spend.
- Video length and completion rate.
- Screen brightness and eye comfort.
- Password habits among users.
- Music tempo and study focus.
Social and community data
- Recycling habits in a community.
- Public transport is used across a week.
- Volunteering rates among students.
- Reading of news across platforms.
- Attitudes to a local issue by age.
- Household energy use over a month.
- Travel choices and distance.
- Charitable giving among students.
- Attitudes to sustainability by age.
- Commuting mode and satisfaction.
- Local footfall across the week.
- Waste produced by a household.
- Voting intention by demographic.
- Community event attendance.
Psychology and behaviour
- Colour preference and mood.
- Music and concentration.
- Memory and time of day.
- Reaction time and caffeine.
- Risk-taking and age.
- Reported happiness and social contact.
- Multitasking and task accuracy.
- Stress and exam proximity.
- Motivation and reward.
- Sleep and reported focus.
- Decision speed under pressure.
- Confidence and test performance.
- Personality type and study preference.
- Reported focus and background noise.
Food and consumer choices
- Coffee consumption among students.
- Snack choices and time of day.
- Meal skipping and reported energy.
- Brand loyalty in a product category.
- Price sensitivity for a product.
- Portion sizes across outlets.
- Vegetarian choices among students.
- Sugar intake across a week.
- Food waste in a household.
- Preferred takeaway by day.
- Water versus soft drink consumption.
- Breakfast habits and morning focus.
- Impulse buying at checkouts.
- Loyalty card use and spend.
Everyday and observational projects
- Car colours passing a point.
- Wait times at a crossing.
- Weather and reported mood.
- Handedness in a sample.
- Shoe size and height.
- Reaction time by age.
- Coin-toss fairness over many trials.
- Traffic flows across the day.
- Queue speed at different tills.
- Birth months in a sample.
- Number of siblings and household size.
- Screen orientation preferences.
- Left versus right seat choice.
- Rainfall and umbrella use.
Environment and sustainability
- Household recycling by material.
- Energy use by appliance.
- Water use across a week.
- Travel emissions by mode.
- Waste produced by packaging type.
- Attitudes to plastic use.
- Local air quality across the day.
- Food miles in a weekly shop.
- Reusable versus single-use choices.
- Temperature and energy use.
- Litter counts in an area.
- Reported willingness to pay for green products.
- Public transport versus car use.
- Seasonal energy consumption.
How do you plan and run your project?
Once you have a question, plan the whole project before collecting anything. Decide exactly what you will measure and how, choose whether to gather your own data or use an existing dataset, and work out a realistic sample size for your time. If you are surveying or observing people, consider the ethics of doing so, and if your course expects it, set the plan out in a short research proposal first. Collect the data carefully, since messy data undermines the analysis, then apply the statistical methods you have been taught and interpret what the results actually mean rather than just reporting numbers. When you write it up, a clear structure, question, method, results, then interpretation, makes the project easy to follow.
Choosing the right project for your assignment
With 130 ideas above, the deciding factor is data. Favour a question you can realistically collect data for in the time you have, with an analysis that matches the methods you know, since an ambitious idea you cannot finish is worse than a modest one done well. Check the project suits your course and the level expected, and keep the sample achievable. A smaller, well-collected dataset always beats a large one you cannot complete. Whichever idea you choose above, the same rule holds: pick a measurable question, make sure you can gather the data, and let a clear analysis, not a big dataset, carry the project.
Ready to develop your capstone project? Let our experts help.
Once you’ve chosen your topic, the next step is turning your idea into a structured project with clear research, analysis and presentation. Explore our capstone project writing support for guidance throughout your project.
Popular posts

How to Write a PESTLE Analysis for an Assignment (with Example, 2026)
August 23, 2026

Can Students Access Turnitin Without Their University? Here Is the Truth
April 15, 2026
How to Write a SWOT Analysis for an Assignment (with Example, 2026)
August 24, 2026
Scribbr vs Turnitin: Which Plagiarism Checker Is Better? (2026)
June 5, 2026
IEEE Referencing: A Full Guide with Examples (2026)
September 6, 2026
Want more tips & great deals? Get them sent to your inbox
Please enter a valid E-mail
By clicking "Subscribe" you agree to be contacted via e-mail. You can always unsubscribe from the newsletter


